Example: Composite Hybrid System with Zero-order Hold Subsystem
In the following example we create a composite system that consists of three subsystems:
- a linear time-invariant plant,
- a controller, and
- a zero-order hold.
Each subsystem is a subclass of HybridSubsystem .
First, we create the linear time-invariant plant, using the class hybrid.subsystems.LinearContinuousSubsystem .
A_c = [0, 1; -1, 0];
B_c = [0; 1];
plant_zoh = hybrid.subsystems.LinearContinuousSubsystem(A_c, B_c);
Then, create a linear feedback for the plant that asymptotically stabilizes the origin of the closed loop system. The controller is a hybrid.subsystems.MemorylessSubsystem because it has no internal state values.
K = [0, -2];
controller_zoh = hybrid.subsystems.MemorylessSubsystem(2, 1, @(x, u) K*u);
Next, we create a zero-order hold subsystem from the hybrid.subsystems.ZeroOrderHold class.
zoh_dim = plant_zoh.input_dimension;
sample_time = 0.3;
zoh = hybrid.subsystems.ZeroOrderHold(zoh_dim, sample_time);
The composite hybrid system is created by passing the plant, controller, and ZOH subsystems to the CompositeHybridSystem constructor.
sys_zoh = CompositeHybridSystem(plant_zoh, controller_zoh, zoh);
Set the inputs functions for each subsystem.
sys_zoh.setInput(plant_zoh, @(~, ~, y_zoh) y_zoh);
sys_zoh.setInput(controller_zoh, @(y_plant, ~, ~) y_plant);
sys_zoh.setInput(zoh, @(~, y_controller, ~) y_controller);
Print the system to check that everything is connected as expected.
sys_zoh
sys_zoh =
CompositeHybridSystem:
├ Subsystem 1: (hybrid.subsystems.LinearContinuousSubsystem)
│ 		       Input: @(~,~,y_zoh)y_zoh
│ 		      Output: y1=@(x)C*x
│ 		 Dimensions: State=2, Input=1, Output=2
├ Subsystem 2: (hybrid.subsystems.MemorylessSubsystem)
│ 		       Input: @(y_plant,~,~)y_plant
│ 		      Output: y2=@(x,u)K*u
│ 		 Dimensions: State=0, Input=2, Output=1
└ Subsystem 3: (hybrid.subsystems.ZeroOrderHold)
  		       Input: @(~,y_controller,~)y_controller
  		      Output: y3=@(x)x(1:zoh_dim)
  		 Dimensions: State=2, Input=1, Output=1
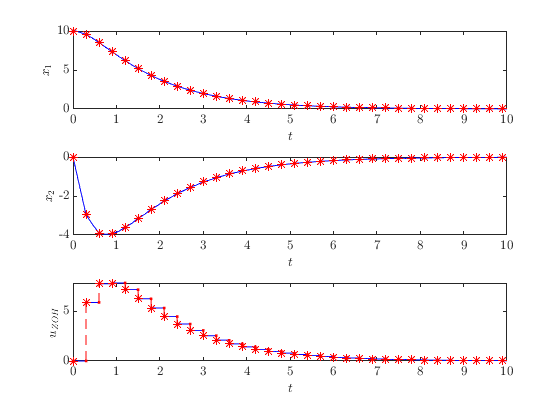
Finally, simulate and plot.
sol_zoh = sys_zoh.solve({[10; 0], [], [0; zoh.sample_time]}, [0, 10], [0, 100]);
HybridPlotBuilder().subplots('on')...
    .labels('$x_1$', '$x_2$', '$u_{ZOH}$')...
    .plotFlows(sol_zoh.select(1:3))
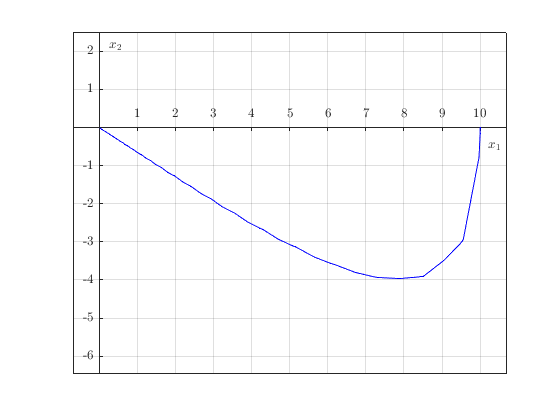
The subsystem solutions can also be plotted in isolation.
HybridPlotBuilder().subplots('on')...
    .title('Trajectory of Plant State')...
    .plotPhase(sol_zoh(plant_zoh))
axis equal
axis padded
grid on
set(gca(), 'XAxisLocation', 'origin');
set(gca(), 'YAxisLocation', 'origin');